|
Script:
RTT ATR DTR
 Back to Catalogue Back to Catalogue
Purpose:
Create a window with Average True Range (Line) and Daily True Range (Histogram).
The Average is calculated as Exponential Moving Average over the DTR bars.
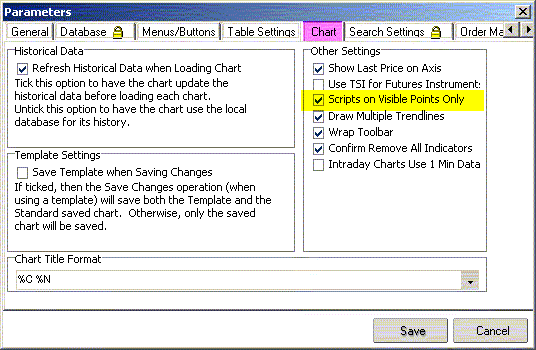
To save time, it is recommended to set the global chart parameters to "calculate visible points only". This means the script calculates and draws only for the days visible in the current window. (see "Parameters" below)
If you zoom out and wish to expand the plot, right-click inside the window, select the script's Properties, and click "OK". That will redraw the plot for the larger time frame.
Please note that plotted scripts work on any time scale. Substitute "tick" (week, hour, month...) for "day" where appropriate.
 Back to Catalogue Back to Catalogue
References:
Investopedia: ATR
IncredibleCharts: ATR
IncredibleCharts: Stop loss
D.Guppy
 Back to Catalogue Back to Catalogue
Parameters:
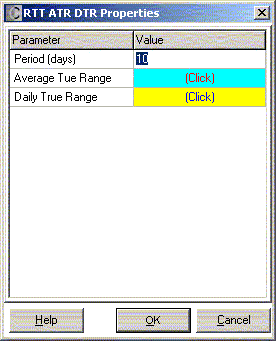
Period = number of days, over which ATR is calculated

Global (File) Parameter Setting for Chart to draw plotted scripts faster:

 Back to Catalogue Back to Catalogue
Example

Back to Catalogue
|


